Performing a Break-Even Analysis can answer vital business questions. It helps determine the number of units needed to break even and when profitability will start. By evaluating cost, volume, and pricing relationships, you can pinpoint your break-even volume. This understanding is essential for budgeting, product planning, and profit forecasting.
Reaching that break-even point is a business’s first step toward profitability! So how do we get there? When conducting a Break-Even Analysis, you need to know your variable costs to produce one unit, your fixed costs, and the selling price of one unit.
Costs that are incurred to produce one unit are called variable costs. For example, variable costs include the cost you pay your manufacturer or wholesaler, costs you pay your prep center and shipping costs. Fixed costs are your “overhead” type costs or costs that don’t vary directly with unit volume. These include things like rent for your warehouse, software subscriptions, your bookkeeper and professional development courses. The selling price is a variable you can adjust based on your experience in the marketplace.
BREAKEVEN = FIXED COSTS / (SELLING PRICE – COST TO PRODUCE ONE UNIT).
For example, if it costs $50 to produce a unit and there are fixed costs of $1,000, the break-even point for selling the units would be:
If selling price is $100: 20 units (Calculated as 1000/(100-50)=20)
If selling price is $200: 7 units (Calculated as 1000/(200-50)=6.7)
As demonstrated in this example, if you sell the product for a higher price, the break-even point will come faster.
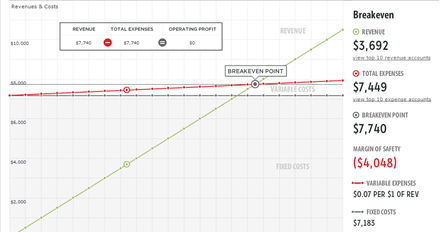
At bookskeep, we utilize Fathom, a financial reporting software, for Break-Even Analysis. The image below presents a sample analysis with data, results, and a graph. Fixed costs are represented by the gray shaded area, while variable costs are shown by the red line added to the fixed costs. The break-even point occurs where revenue intersects the red line. The upper right section of the graph, where the red line is below the green line, indicates profits. These insights help us assist clients in evaluating cost structures and enhancing profitability.
See our other blogs at bookskeep Blogs!
Want to book an appointment? Contact us now!

Leave a Comment